WEATHER FORECASTS
National Institute of Meteorology and Hydrology


NIMH issues weather forecasts based on numerical models, ground measurements, radar and satellite information
NIMH, together with the meteorological services of 25 other European and North African countries, is a member of the international consortium ACCORD (A Consortium for Convection-scale modeling Research and Development), where the regional numerical models ALADIN and AROME are developed. The configuration and maintenance of the hydrostatic ALADIN-BG and the non-hydrostatic AROME-BG at NIMH is carried out by the team of the "Numerical Modeling" section, "Forecasts and Information Services" department. The configurations of the operational numerical models are the following:
ALADIN – BG (hydrostatic)
- horizontal resolution of 5 km,
- 105 vertical levels,
- time step of 300 s.
- forecast range of 72 hours twice daily (at 06 and 18 UTC) and 48 hours twice daily (at 00 and 12 UTC); the domain of integration is centered in Bulgaria and covers almost the entire Balkan Peninsula.
AROME – BG (cloud-resolving)
- horizontal resolution of 2.5 km,
- 90 vertical levels,
- time step of 60 s.
- forecast range of 48 hours four times daily (00, 06, 12 and 18 UTC); the domain of integration covers Bulgaria and surroundings.
Below follow animated forecasts of temperature, wind, cloud cover and precipitation from the ALADIN-BG and AROME-BG models. For a detailed view you can visit this page
ALADIN-BG—Clouds

AROME-BG—Temperature
AROME-BG—Precipitation
Operational Lightning Probability Forecasting System
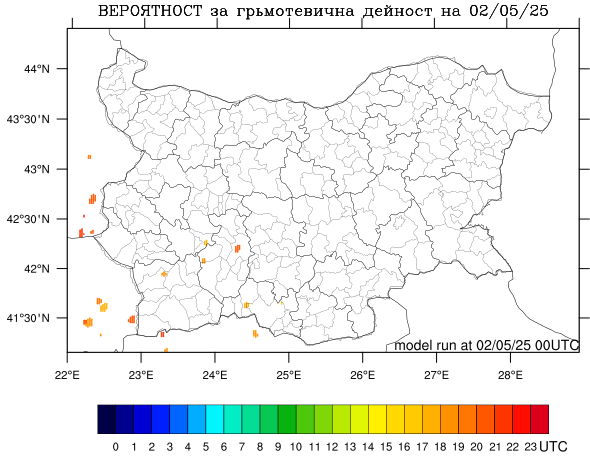
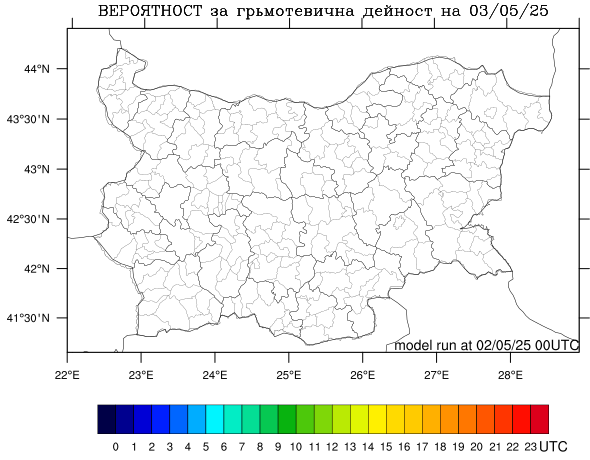
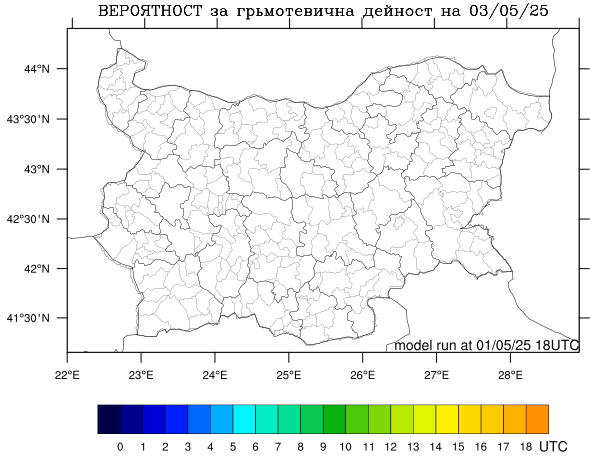
The numerical prediction of lightning probability is based on the predictive output of AROME-105 for microphysical fields at height, starting from the theory of thundercloud electrification due to hydrometeor interactions within thunderclouds. It should be kept in mind that the presence of conditions for the electrification of convective clouds does not always lead to the development of lightning activity within them. The lightning probability plots provide information on where the electrification conditions are present for the AROME-105 convective clouds predicted by the non-hydrostatic (cloud-resolving) model.
Comfort Index
The maps are generated on the basis of the forecast of ALADIN-BG weather model.
The proposed maps show the current or expected feeling of thermal comfort/discomfort of the majority of people. The maps refer to a standard time of day, which corresponds to the classical observation periods at weather stations. For example, 12 UTC (Coordinated Universal Time) corresponds to 14:00 Bulgarian time (15:00 summer time), which is usually close to the warmest hours of the day, and 03 UTC corresponds to 05:00 Bulgarian time (06:00 summer weather) which is usually close to the coldest hours of the day.
Thermal Comfort Classes, Description of the Sensation of Comfort/Discomfort and Recommended Clothing
The table shows the degrees of thermal comfort/discomfort. The categories of comfortable, warm and hot are defined on the basis of the degrees of physiological stress to which the human thermoregulatory system is subjected in the different temperature conditions according to the feels like temperature. The categories for cold are according to the Wind Chill Index.
| Thermal comfort class | From feels like temperature, °С | To feels like temperature, °С | Grade in colour | Thermal sensation of comfort or discomfort | Description | Level of clothing |
| 13 | 44 | - | Extreme heat | Substantial risk of thermal shock in prolonged work/stay outdoors. | 0.4 | |
| 12 | 38 | 44 | Very hot | The mechanism of self-cooling by sweating is hindered. | 0.4 | |
| 11 | 32 | 38 | Hot | Almost the whole body is covered in sweat. | 0.4 | |
| 10 | 26 | 32 | Very warm | A big part of the body is covered with sweat. | 0.4 | |
| 9 | 20 | 26 | Warm | Sweating has started. A small part of the body is covered with sweat. | 0.5-0.4 | |
| 8 | 10 | 20 | Comfortable | Sensation of thermal comfort with suitable clothing | 1.0-0.5 | |
| 7 | 0 | 10 | Cool | Thermal comfort can be achieved with suitable clothing, but there is slight discomfort in the cold side on exposed parts of the body. | 1.5-1.0 | |
| 6 | -10 | 0 | Cold | Goosebumps start. | 2.0-1.5 | |
| 5 | -18 | -10 | Very cold | Shivering starts. | 2.4-2.0 | |
| 4 | -27 | -18 | Possible frost bite | Possible frost bite of bare skin | 2.9-2.4 | |
| 3 | -35 | -27 | Frost bite of bare skin | Frost bite of bare skin within 30 min of exposure | 3.3-2.9 | |
| 2 | -47 | -35 | Rapid frost bite of bare skin | Frost bite of bare skin within 10 min of exposure | 3.9-3.3 | |
| 1 | - | -47 | Dangerously rapid frost bite | Dangerously rapid frost bite with 5 min of exposure | 4.0 |
Clothing Index—Meaning
| Recommended clothing ensemble | Clothing index |
|---|---|
| Nude | 0 |
| Shorts | 0.1 |
| Shorts, open-neck shirt with short sleeves, sandals | 0.35 |
| Long light-weight trousers, open-neck shirt with short sleeves, open shoes | 0.5 |
| Long trousers, open-neck cotton work shirt with long sleeves, shoes | 0.7 |
| Long trousers, cotton work shirt with long sleeves, shoes, and a light jacket | 0.9 |
| Typical business suit (long trousers, cotton work shirt with long sleeves, vest, shoes, and a jacket) | 1.0 |
| Typical business suit and a cotton coat | 1.5 |
| Long resistant trousers, woolen flannel shirt, woolen socks, shoes, wind and water resistant jacket and vest, a hat and gloves | 1.5-2.0 |
| Polar weather suit with hood, warmth-keeping shoes, a hat covering the ears, strong isolating gloves | 3.0-4.0 |
Felt Temperature
Felt temperature is air temperature in a reference atmospheric environment where a person's sense of thermal comfort/discomfort would be the same as in real weather conditions. The feeling of thermal comfort is calculated using a full numerical model of thermal balance of the body of a "standard" human placed in atmospheric conditions near ground, outdoors, on grass or snow cover, if available. The feeling of thermal comfort/discomfort depends on the morphological parameters of the person - age, sex, height, weight and others, but for general purposes, the parameters of a "standard" person are used here. This is a 35-year-old man, 1.75 m tall, weighing 75 kg, in good health. The felt temperature depends on the work performed by the person and can be calculated at different power. In this case, it is assumed that the "standard" person performs work with applying the power corresponding to walking at a speed of 4 km/h on a horizontal surface. It is assumed that the wind always blows to the side of the direction of walking. The clothing is adapted (summer/winter) so that the "standard" person, if possible, achieves thermal comfort in the specific outdoor weather conditions. To determine the felt temperature, data on meteorological elements in the layer of air near the earth's surface (0–2 m), where the "standard" person is located, are used: air temperature; relative air humidity; wind speed; presence of snow cover. Also used: amount of cloud cover; geographical coordinates and altitude of the place; date and time.
Operational Ground Surface Temperature Analysis and Forecast
The maps are generated on the basis of the forecast of ALADIN-BG weather model.
The ground surface temperature (also called “skin” temperature) is calculated for a grassy horizontal, flat ground surface outdoors with no horizon limitation. This is the temperature of the upper effective boundary of the grass or the exposed surface of the snow cover, if any. It is assumed that the grass surface is maintained in accordance with the recommendations of the World Meteorological Organization for the arrangement of a park for conducting meteorological measurements. It should be mowed at a height of several centimeters above the soil surface.
The temperature at a height of 5 cm above the soil surface is the closest temperature measured at a standard level to correspond to the temperature of the grassed ground surface.
The “skin” temperature is determined with a numerical thermal balance model constructed to use standard data of meteorological parameters: temperature and relative humidity of the air at a height of 2 m, wind speed at 10 m, amount of cloudiness, geographical location, date and time for solar radiation.
The sunlit land surface temperature can be much higher than the air temperature at 2 m, while the nighttime land surface temperature can be much lower in cloudless, dry and calm weather.
Fire Index
| Степен на риск/ Hazard | Описание на български | Description in English |
| Малък Low | Съществуващи пожари се самозагасяват и е малко вероятно да възникват нови. Жизнени пожари са възможни само като тлеене в дълбоки сухи слоеве. | Fires likely to be self-extinguishing and new ignitions unlikely. Any existing fires limited to smoldering in deep, drier layers. |
| Умерен Moderate | Възможни са леки и бавно развиващи се пожари. Съществуващи пожари се гасят лесно от наземни екипи с помпи и ръчни инструменти. | Creeping or gentle surface fires. Fires easily contained by ground crews with pumps and hand tools. |
| Голям High | Възможни са умерени до силни пожари с въвличане на дървесни корони само локално. Пожарите са трудни за овладяване от наземни екипи. Често се налага използване на тежка екипировка за овладяване на пожарите (булдозери, камиони-цистерни, самолети). | Moderate to vigorous surface fire with intermittent crown involvement. Challenging for ground crews to handle; heavy equipment (bulldozers, tanker trucks, aircraft) often required to contain fire. |
| Много голям Very High | Възможни са много силни пожари с частично или пълно въвличане на дървесните корони. Предните фронтове на пожарите е невъзможно да бъдат овладени от наземни екипи. Налагат се въздушни атаки със забавящ агент (retardant), за да се атакуват успешно предните фронтове на пожарите. | High-intensity fire with partial to full crown involvement. Head fire conditions beyond the ability of ground crews; air attack with retardant required to effectively attack fire's head. |
| Екстремален Extreme | Възможни са бързо разпространяващи се много силни пожари с въвличане на дървесните корони. Пожарите са трудни за овладяване. Действията по погасяване се ограничени само по фланговете на пожара. Възможни са само индиректни действия, насочени срещу предните фронтове на пожарите. | Fast-spreading, high-intensity crown fire. Very difficult to control. Suppression actions limited to flanks, with only indirect actions possible against the fire's head. |
| Не се пресмята (сняг) (Snow) | Не се извършват изчисления за този район. (Наличие на снежна покривка). | No calculations were performed for this region. |
Canadian Forest Service (http://cfs.nrcan.gc.ca/)
The system is operational since April,2008 during the warm months (April-October)The Canadian Fire Weather Index, FWI, developed in the Canadian Forest Service Research Center is used.
Data used (input elements for FWI calculation):
- Precipitaion amount for the last 24 hours;
- Air temperature;
- Air relative humidity;
- Wind speed; snow cover presence;
- Day duration.
FWI has three sub-indices showing the "dryness" of different types of "fuel". Each of these sub-idices is a complex function of the meteo-elements. Knowing the sub-indices and wind velocity data, two other sub indices are calculated, which evaluate the initial fire kindling and the available "fuel" for the further unfolding of the fire. On their basis the FWI in calculated and it gives an overall assessment of the intensity of fire unfolding (in energy released per unit time per unit length along the fire front line).
Some Products Developed in NIMH Based on the GFS Model of NCEP-NOAA
GFS - 7-day Forecast:
Wind
Temperature field at 850 hPa isobaric height
Forecast start time: top left, forecast period: top right, end time: +118
Animated information from NOAA's Global Forecasting System on the expected air temperature at an altitude of about 1500 m.
During the cold half of the year a light blue line plots the minus 5°C isotherm. North of this line, precipitation is very likely to be snow, south of it, rain.
In the warm half of the year a red line draws the plus 20°C isotherm. South of it it gets hot during the day with temperatures above 35°C.
Cold air masses are represented by colours from blue to purple, and warm air masses—by colours from yellow to red.
The coastlines and borders of Bulgaria are represented by a black outline.